Ghidra configuration
This is a list of things that you can do to significantly improve your Ghidra experience. I’ll try to put “uncontroversial” things here, and then I’ll write a separate blog post with more invasibe changes I inflicted on my decompiler.
- 1. Dark theme
- 2. Dock the windows
- 3.1 Change the font
- 3.2 Cursor text highlight
- 3.3 Markup variable references
- 3.4 Maximum lines to display
- 3.5 Maximum numbers of xrefs to display
- 3.6 Plate comments and labels
- 3.7 Decompiler analysis options
- 3.8 Decompiler display options
- 3.9 Comment quick-entry
- 3.10 Initial analysis options
- 3.11 Auto analysis options
- 4.1 Listing fields
- 4.2 Program overview
- 5. Bytes View
- 6. Tool reuse
- Next steps
1. Dark theme
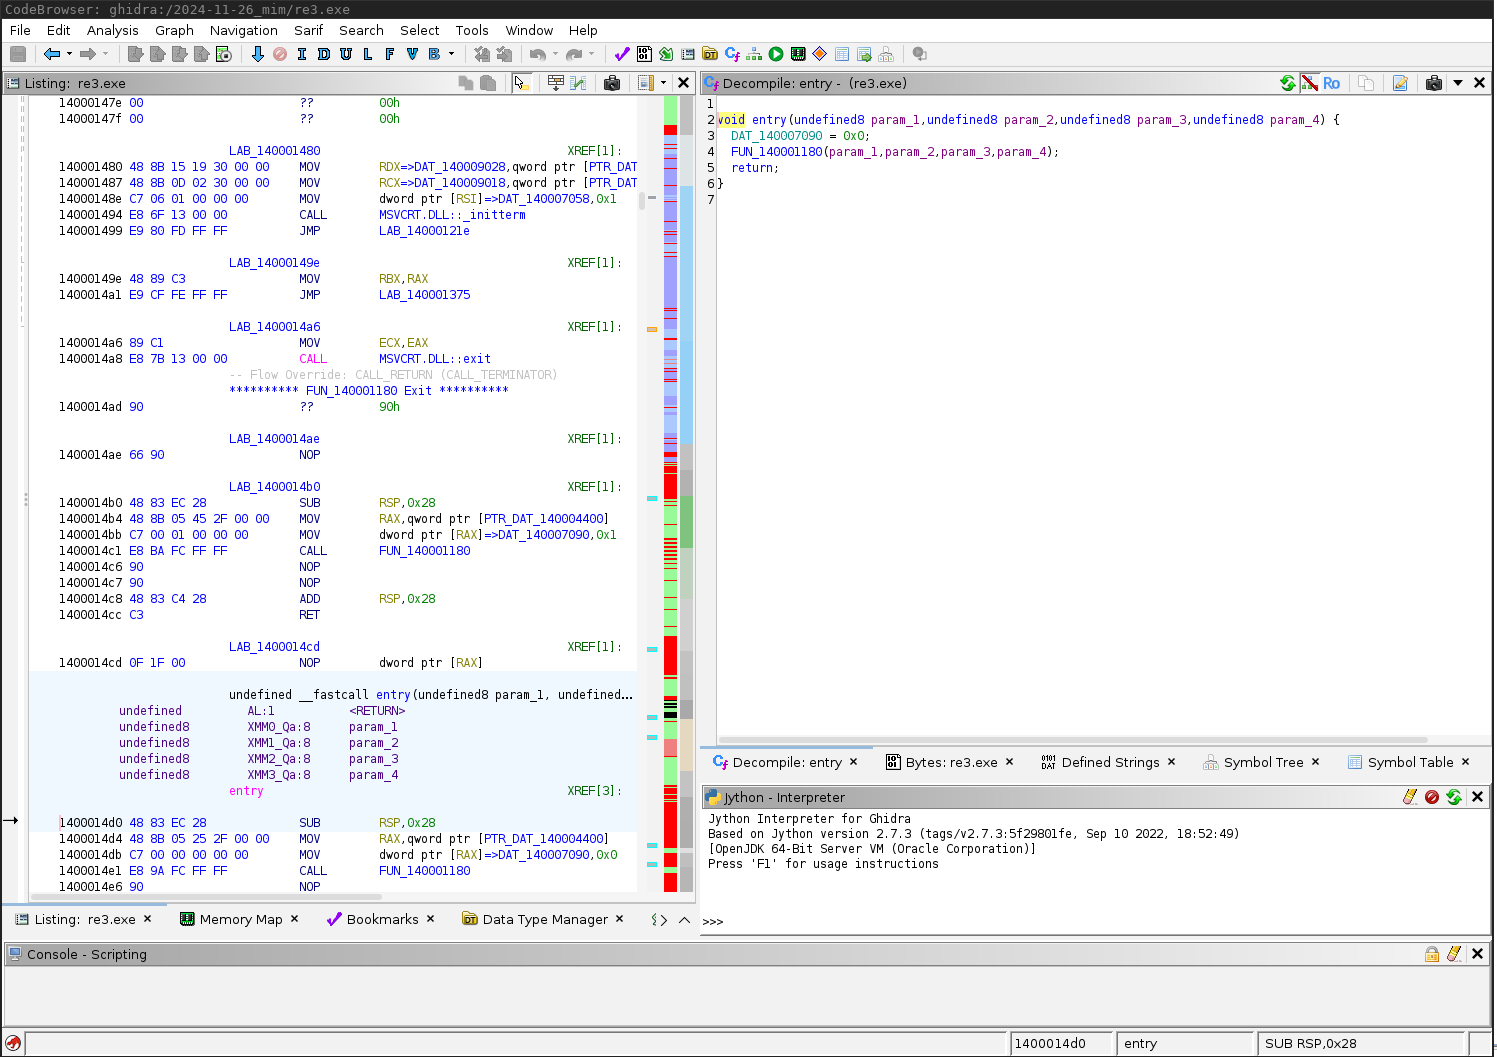
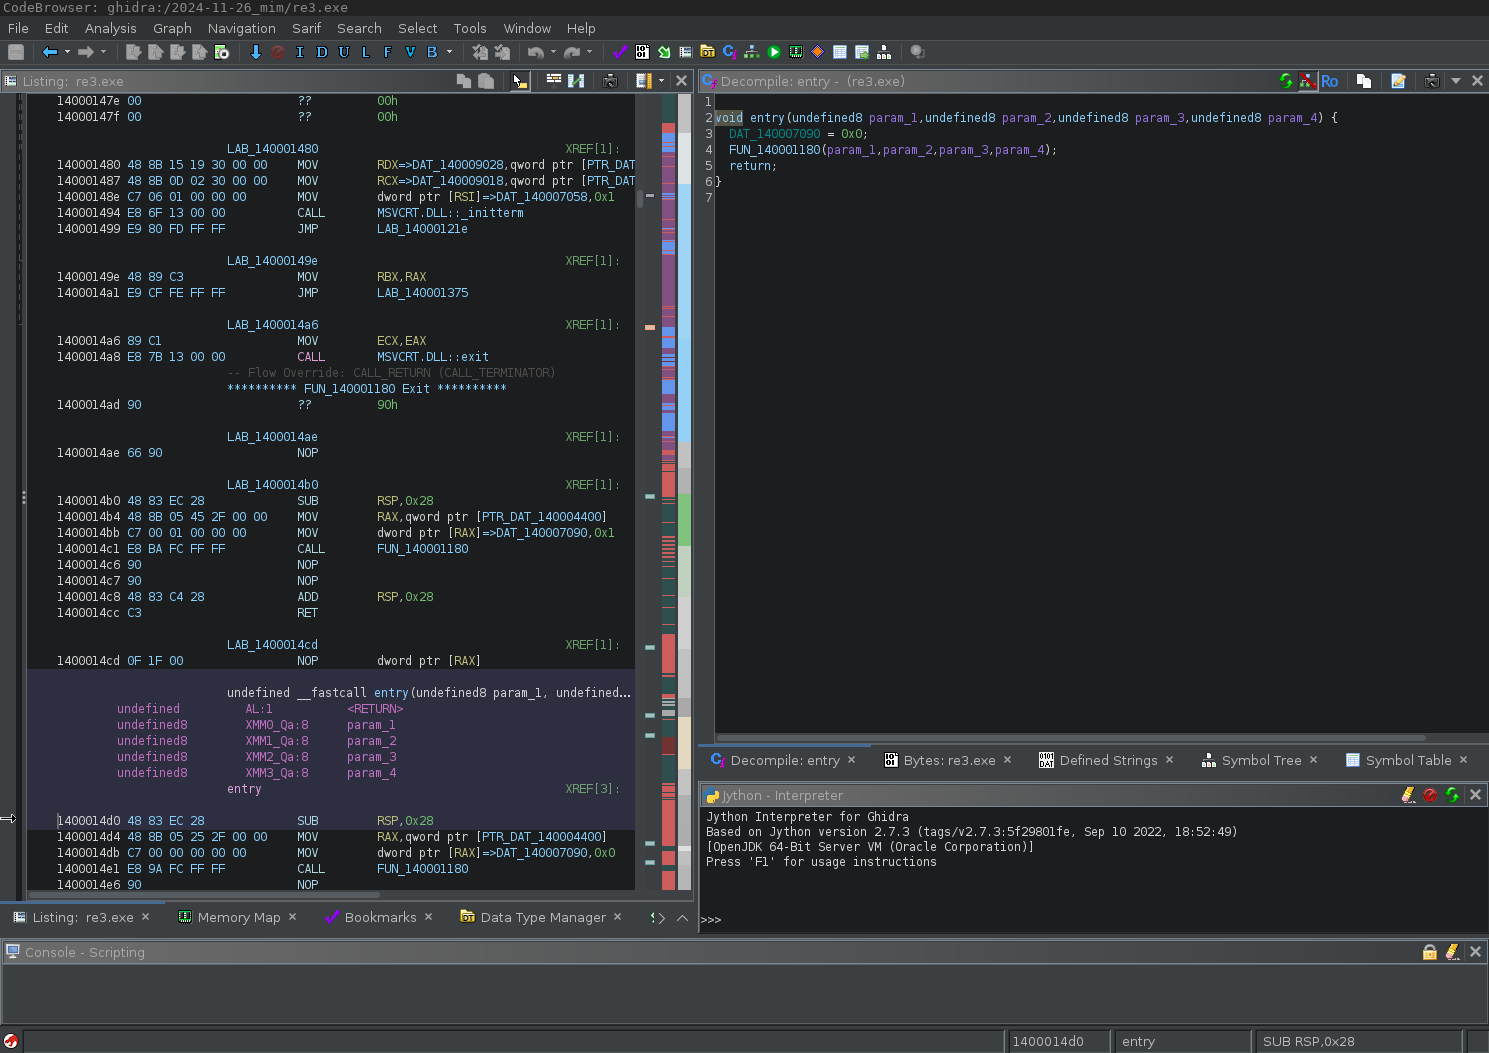
Save your eyes, change the default theme. In the main tool select Edit->Theme->Switch
and select Flat Dark Theme (of pick another one you like).
Before:
After:
2. Dock the windows
Dock the windows in a reasonable way. Pick a layout you like (you can see on the screen that
my is quite minimalistic). No matter what you do, remember that
Ghidra keeps this setting - at any point you can do File->Save Tool and your window layout
will be safely stored on the disk.
No, really, I mean it. I dock all the windows. By default most windows jump at me and frighten me (script manager, bundle manager, xref search results, probably more). I always dock them to one of the panels so they stay in their lane and don’t show up in random places. But I use a tiling window manager, so that may influence my choice.
I personally close everything and just keep two windows next to each other. This looks roughly like this (the set of open tab varies, but the layout does not):
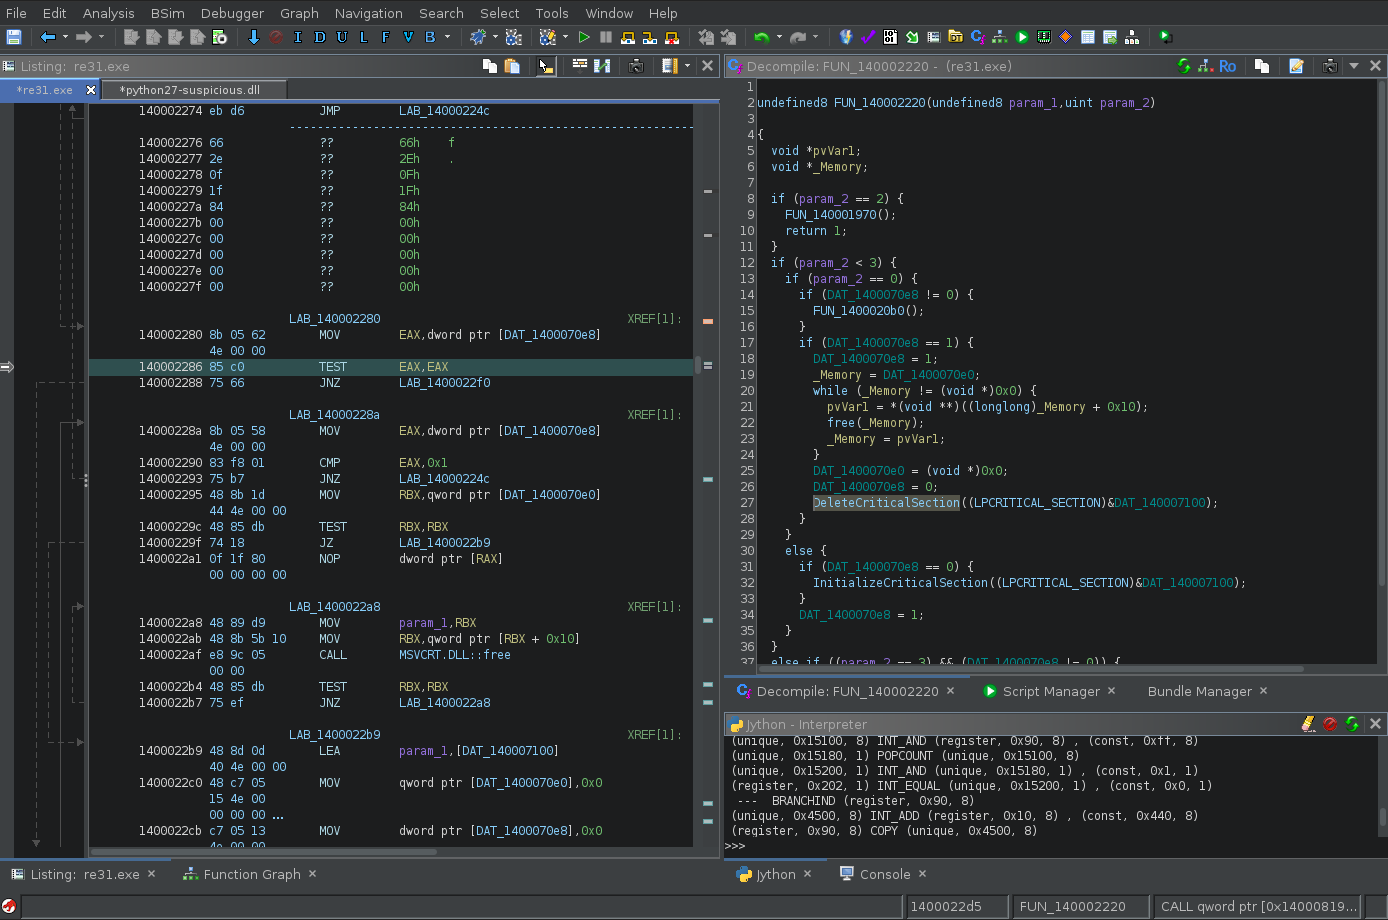
Before I released ghidralib and started writing ad-hoc scripts in the Jython interpreter, I just had two screens next to each other, now I also have a small console open.
This is a pretty extreme minimalism (but it makes sense if you have keybindings confgured and memorised). It’s OK if you keep a few more windows open, but nevertheless consider reducing the visual clutter that Ghidra has by default.
3.1 Change the font
This is not strictly required. The default font is OK, but I wouldn’t call it
beautiful. I personally use Fira Code (13pt), but pic a one you like. To do this, go
to Edit->Tool Options and type font into filter:
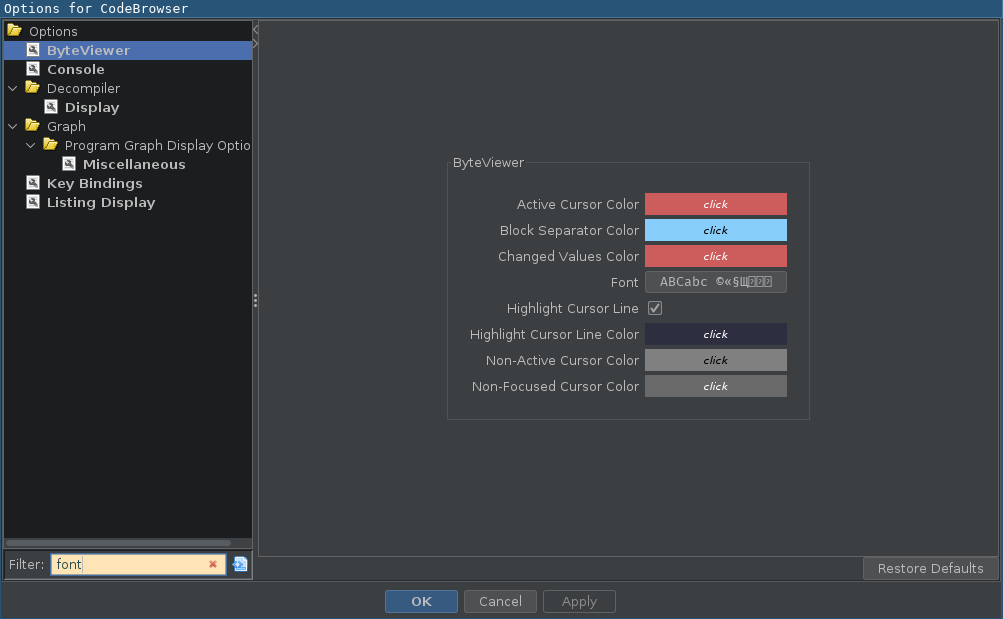
This is a generic technique that you should use any time you want to configure something.
Then just visit every row left after filtering and set the font there (there are many
fonts configutable separately, but I just use the same font everywhere). I personally
use FiraCode Nerd Font 12pt, but YMMV and pick the one you like.
3.2 Cursor text highlight
While you’re in tool options, let’s configure several more things.
First, go to Listing Fields->Cursor Text Highlight and change the Mouse button To Activate
option to LEFT. This will highlight element pointed by the mouse, which is extremely
useful (by default this happens on middle click).
3.3 Markup variable references
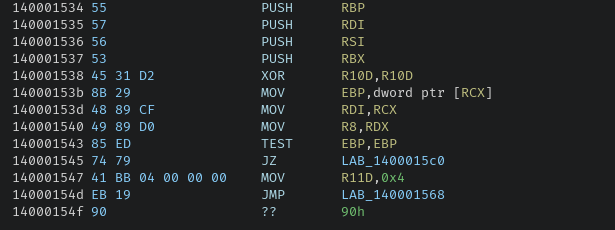
Ghidra will replace register names in the listing with the inferred parameter names. YMMV but I personally rarely find this feature useful, and often annoying:

Go to Listing Fields->Operands Field and disable Markup Inferred Variable References
and Markup Register Variable References. Register names are back:
3.4 Maximum lines to display
In the same view, set Maximum Lines To Display to 200. This is useful for showing long
data that would otherwise be truncated.
3.5 Maximum numbers of xrefs to display
In Listing Fields->XREFs Field consider changing Maximum Numbef or XREFs to Display to 50.
That’s a lot, but XREF field is one of the most useful things Ghidra can show - I don’t want
to truncate them except in extreme situations.
3.6 Plate comments and labels
By default Ghidra shows a large (and largely useless) plate in front of every function.
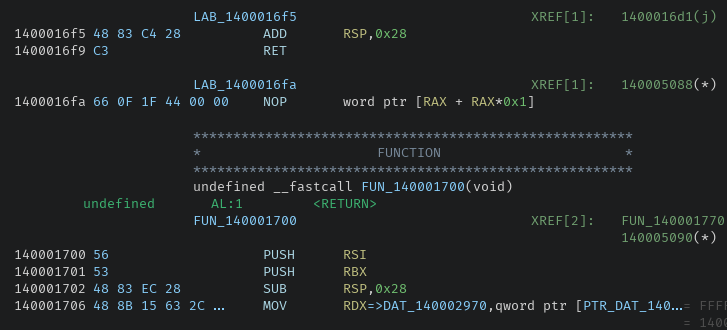
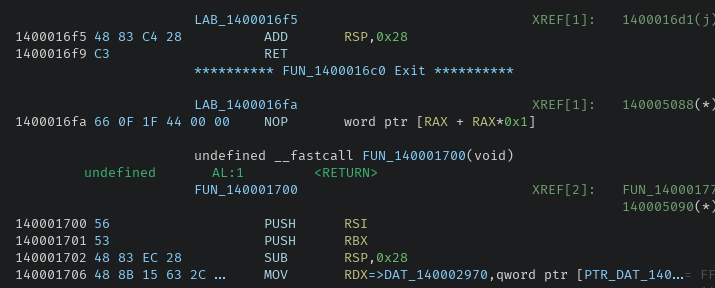
You can change that in Listing Fields->Format Code. Tick off Show Function Plates.
I personally like to turn ON Flag Function Exits - sometimes Ghidra truncates
functions at surprising place, and it’s good to know when this happens.
Also I want to see function exits immediately at glance.
3.7 Decompiler analysis options
We’re not done with Tool Options yet. In Decompiler->Analysis
Decide if you want to see unreachable code - it’s controlled by the
Eliminate unreachable codeoption. I personally want to, because I often work with very obfuscated code and don’t want to risk missing something. But in most cases enabling dead code elimination will simplify the code you see in the decompiler.Turn on
Use implace assignment oprators. This rarely works, but sometimes it does - and it’s almost always better to havemyData[something] += uVar1instead ofmyData[something] = myData[something] + uVar1.
Before:

After:

3.8 Decompiler display options
In Decompiler->Display:
- I personally prfer to remove the (useless) empty line after a function definition.
You can do it via
Brace format for function blocks. - I prefer C++-style comments (
//instead of/* ... */) - I recommend to enable printing
NULLfor null pointers. - You can configure shorter or longer lines, depending on your screen size and preference. I like the default 120 in this case.
3.9 Comment quick-entry
Now this one is really minor, but I often add short comments to my code. In Options->Comments you can pick one of:
- [ctrl]+[enter] accepts the comment, [enter] inserts a newline
- [enter] accepts the comment, [shift]+[enter] inserts a newline
I prefer the latter, slightly, but pick whatever you like. I’m just making you aware of that option.
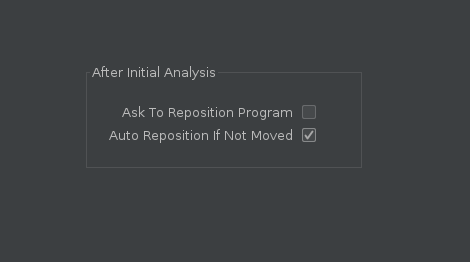
3.10 Initial analysis options
By default, every time when you open a new project, Ghidra will do the analysis, and after a minute, when you’re already reversing, it’ll ask “do you want to go to the entry point”?
No, I don’t want to go there. I was there a minute ago. I don’t want to go there again. You can disable this question in the initial analysis options.
3.11 Auto analysis options
If you’re particularly lazy, you can enable automatic auto-analysis to save you a click every time you import a new file:
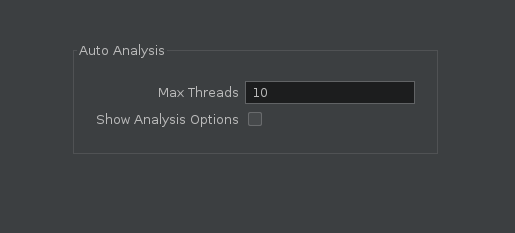
This will run auto-analysis with default options every time you open a new file. I’m a bit undecided on this, since there are legitimate reasons when you might not want to run auto-analysis. They are rare, but they happen. For that reason I don’t enable this personally.
4.1 Listing fields
Do you know that you can configure the fields you see in the listing? Just click that tiny white-orange button:

And you get to configure every aspect of this view:

I think I personally only changed the operands field to be a bit wider. Oh and by the way,
you can enable showing PCode here if you need it to debug something. Just right click on
PCode and select enable field.
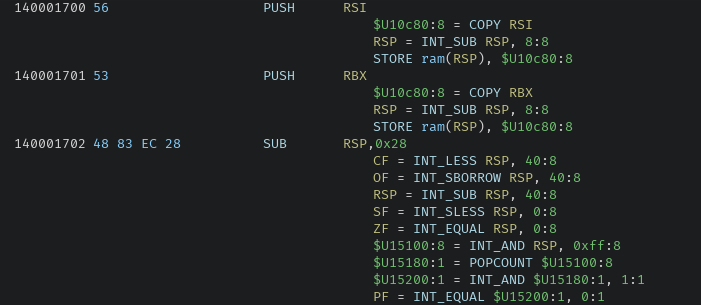
Obviously not recommended for everyday use.
4.2 Program overview
While we’re talking about the listing, don’t you miss that bar on top of IDA that shows which section of program memory is function, code, data, etc?

Turns out Ghidra can do that too. Click the right-most icon (I don’t know what it represents)
and enable Show Entropy and Show Overview (or just one of them if you prefer).
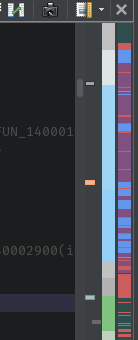
By the way, this is an extension point and plugins can add their own bars. I’m not aware of any plugin that did, but they can.
5. Bytes View
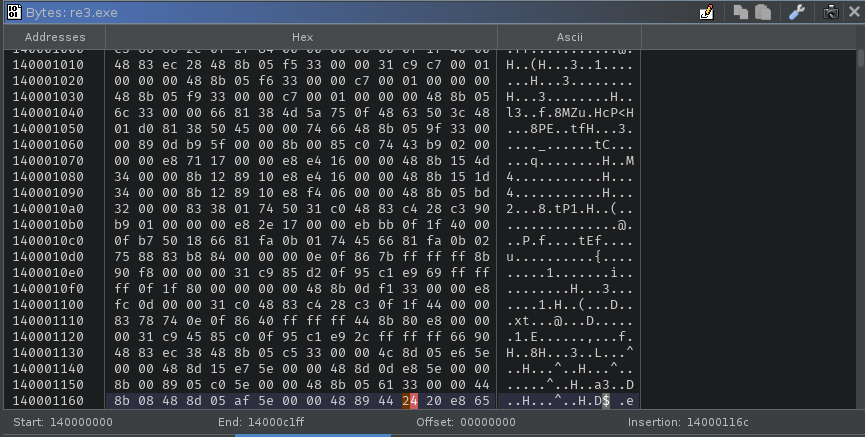
Bytes view is ugly and I hate it. I think about integrating Ghidra with Imhex someday. Anyway, by default even ASCII field is hidden, even though it is extremely useful.
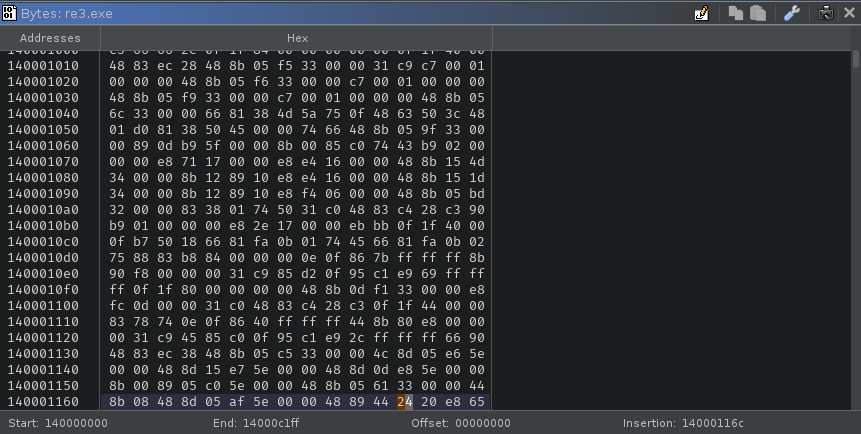
Open the Bytes window (Window->Bytes) and click the wrench icon. Turn on Ascii column.
6. Tool reuse
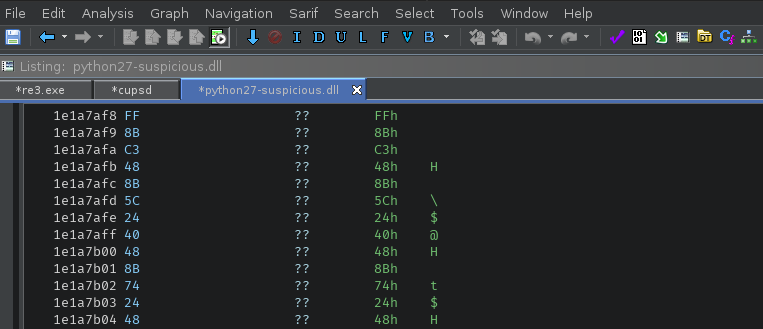
There are also some things you can change in the main tool (the window with a list of
files in the project). Go there, and select Edit->Tool options.
One thing I like to change is to change Default Tool Launch Mode into
Reuse acceptable running tool - this option will open new files
in the same window, in listing window tabs, instead of opening a new window.
You can also add your own keybindings there if you want, of course.
Next steps
Actually I think that’s all about the basic configuration I have to say.
Remember to save your tool (file->save tool). Actually, export the tool
(file->Export->Export Tool As) and save it somewhere so you won’t lose your
changes randomly. As an another bonus, you can take this file with you when you
switch machines.
I plan to write about reasonable keybindings and unusual Ghidra settings later.
For more ideas, see the Ghidra table of contents page.